
- read
- Daniele Paganelli
The relationship between viscosity and temperature for glasses can be determined indirectly using data provided by the heating microscope and the optical differential dilatometer.
The calculation method is based on the Vogel-Fulcher-Tamman (VFT) equation.
$$ \log\eta = A + \frac{B}{T - T_0} $$
The parameters A, B and T0 are determined by introducing three pairs of known viscosity-temperature (η, T) values into a system of equations.
The calculations are based on the assumption that the viscosity of glasses at several characteristic points can be considered constant:
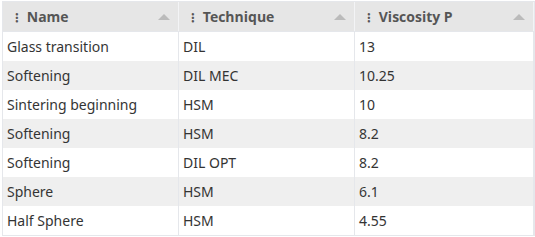
In this study we will use in particular these 3 points:
- η = 1013dPa·S at the vitreous transition point (dilatometer)
- η = 1010dPa·S at the sintering beginning point (heating microscope)
- η = 104.55dPa·S at the half sphere point (heating microscope)
(1 Poise = 0.1 Pa·s = 1dPa·s)
By solving the system of equations and applying the VFT equation, we can calculate the value of viscosity over the entire temperature range.
The calculation is carried out using the data obtained with the dilatometer and the heating microscope.
Firstly, a sample of vitreous material undergo a dilatometric test to obtain its expansion/contraction curve and to identify its glass transition temperature.
The optical dilatometer can record measurement even if the sample soften during the analysis.
In addition, the differential mode avoid any optical mirage.
The two high resolution cameras frame the edges of the sample and the edges of a pure alumina plate at the same time.
This plate is at the bottom of the true sample and it plays two roles, which are the specimen holder and also the reference.
The image analysis software automatically subtracts the (apparent) movements of the reference from those of the sample, thus performing the calibration in realtime.

In this case, as the temperature increases, the instrument records a linear expansion up to the glass transition at 560°C.
Above this temperature, the slope of the line changes and the glass continues to expand up to the beginning of softening at 780°C.
The ends of the sample become rounded due to surface tension so the curve inverts its trend and the dilatometer records a shrinkage.
A heating microscope test is performed at a later time to determine the half sphere temperature thanks to the analysis of recorded images.

Summary:
- Glass transition temperature: 560°C
- Dilatometric softening: 780°C
- Half Sphere temperature: 1180°C
These three pairs of values can be used to solve the system of equations deriving from the VFT equation and to calculate the variation in viscosity.
ELS takes advantages of the online platform, it has been developed in-house and it is specifically dedicated to modelling and calculation.
